iCAMP - NSF
Signal Processing Research | Summer 2012
The summer of 2012 I had the privilege of being funded by the National Science Foundation to perform research in the area of signal processing. I specifically focused on the blind deconvolution of barcode signals. Deconvolution is the process of taking an image or signal that is blurred and has added noise and reconstructs the original image or signal. There are two types of deconvolution: non-blind and blind deconvolution. The distinction between the two types is that non-blind deconvolution is the process of reconstructing a signal/image with the facilitation of known parameters of the blur or noise that corrupted the signal. Blind deconvolution uses little to no knowledge of such parameters. This makes blind deconvolution a complicated process.
Purpose and Application
You may be wondering, why should we care about blind deconvolution of barcode signals? Barcode systems are an essential component of the business world as they allow one to expeditiously retrieve information on products, resulting in an economy with accelerated decision-making. Barcode systems are progressively being implemented as sources of information within the social net-working culture. This has resulted in the implementation of barcode reading software within smartphones. These programs analyze an image of a barcode taken by the phone's camera. This is where problems arise. Images taken by the camera can often be affected by blur and random noise. The result is an unrecognizable barcode. Blind deconvolution allows the retrieval of a recognizable barcode despite the unknown parameters of blur and noise. By implementing a proper blind deconvolution algorithm, the retrieval of information and decision-making can be accelerated. Furthermore, the investigation of blind deconvolution of barcode signals could potentially be extended to other applications of signal processing.
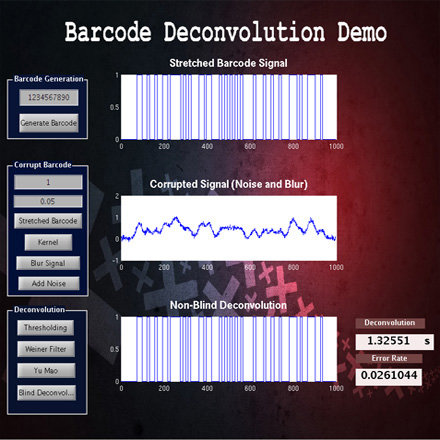
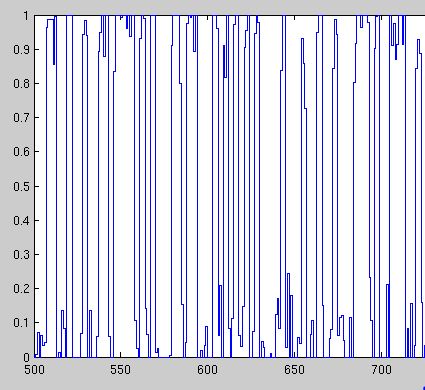
This is a sample of the data used for the experimentation process. The top graph is a graph of the original barcode signal. The second graph is the signal corrupted by Gaussian blur and white Gaussian noise. The third graph is the signal obtained from deconvolution using the classical deconvolution method, the Wiener filter. More efficient methods of deconvolution are explored in my paper.
Summary
Check out my paper and presentation on the research I performed in this subject. I specifically dealt with the UPC barcode structure and worked with several methods of optimization to try and obtain the best signal. To understand the mathematical framework of the analysis you will need a basic understanding of calculus and a decent understanding of linear algebra. You can also check out the GUI I created to demonstrate the experimentation involved in the research. This GUI requires MATLAB and the image processing toolbox.

